Trace Features
Highlights
- Trace
Sinks
- Filter
and Trigger
-
Debugging
- Cache
Analysis
-
Profiling
- Code
Coverage
- Energy
Profiling
Trace Sinks
- Support
for all common on-chip trace buffers
- Trace
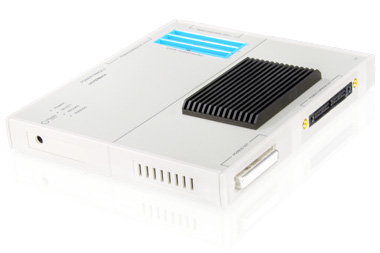
memory within a TRACE32® Debug & Trace Tool with a fixed size (128 MByte
up to 4 GByte) for off-chip trace ports
- TRACE32®
Debug & Trace Tool allows streaming of the trace information to a file
on the host computer whilst it is being recorded. This provides the
capability to use trace memory buffers of to up to 1 T Frames.
-
Real-time processing of streamed trace information provides virtually
infinite trace (ETMv3 and PTM only)
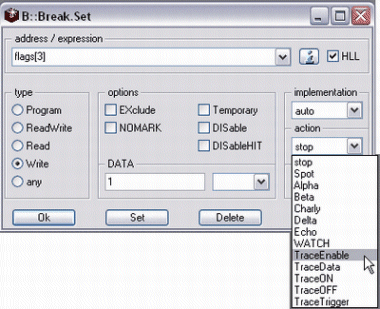
Trace Filter and Trigger
- Sample
only the specified event
- Sample
the complete program flow and the specified data event
- Switch
the sampling to the trace buffer on/off after a specified event occurred
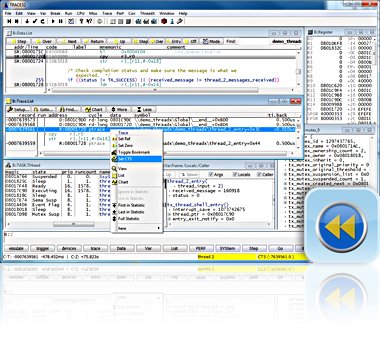
Trace-based Debugging (CTS)
- Allows
re-debuggging of a traced program section
- Provides
forward and backward debugging capabilities
-
High-level language trace display including all local variables
- Timing
and function nesting display
- Has the
ability to fill most trace gaps caused by the limited bandwidth of trace
port
Trace-based Cache Analysis
- Basic
support for all microcontrollers
- Advanced
support for ARM architecture
- Optimize
instruction and data cache usage
- Find bus
transfer bottlenecks
- Verify
effects of code optimisation
- Simulate
effects of different cache sizes
- Various
graphical and numerical displays
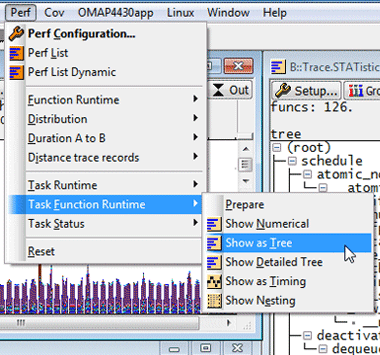
Trace-based Profiling
- Detailed
analysis of function run-times
- Detailed
analysis of task run-times and state
-
Graphical analysis of variable values over the time
- Analysis
of the time interval of a single event (e.g. Interrupt)
- Analysis
of the time interval between 2 defined events
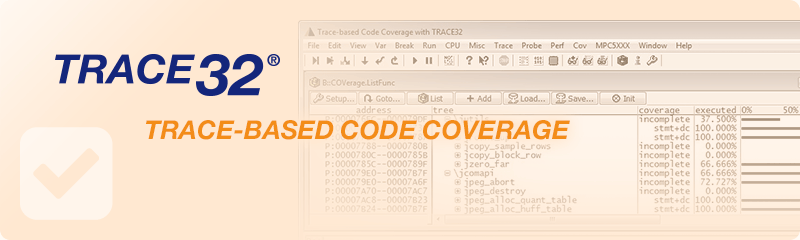
Trace-based Code Coverage
-
Real-time code coverage without instrumentation
- Suitable
for long-term testing
- Support
for all common code coverage metrics
-
Automated report generation
- Full
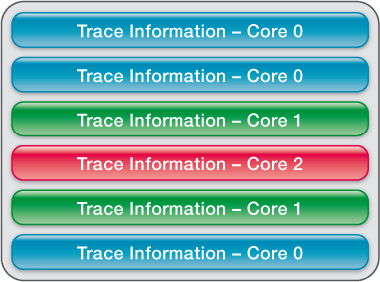
support of multicore chips
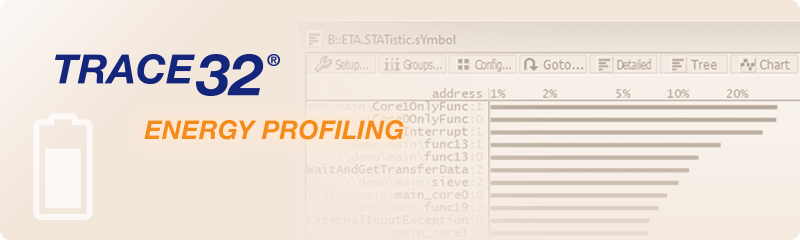
Energy Profiling
- Find the
program part causing the highest energy consumption
- Locate
unexpected power peaks
- Check if
power-saving modes are used efficiently
- Current
and voltage measurement with TRACE32® Mixed Signal Probe or TRACE32®
Analog Probe
- Time
correlation with TRACE32® trace tools PowerTrace, CombiProbe, MicroTrace
- Energy
statistics on function and task level