

Lauterbach provides in addition to its hardware-based debug and trace tools pure software debuggers. These debuggers are used to debug RTL simulations / emulations and virtual targets in the presilicon phase of a project, and - relatively new - to debug the target via native host interfaces such as USB.
TRACE32® Software-Only Products are licensed via TRACE32® Floating Licenses.
- Virtual Targets
- XCP
- USB and Intel® DCI.DbC
- USB and Tessent Embedded Analytics
- TRACE32® Simulators
Virtual Targets
TRACE32® Front-End
- Front-end to third-party virtual targets
- Front-end to third-party core simulators
- Front-end to third-party target servers
- Front-end to TRACE32® Back-End
- Same GUI as TRACE32® hardware debuggers
- Debug features as provided by third-party software/TRACE32® Back-End
- Trace features as provided by third-party software/TRACE32® Back-End
- Windows, Linux and MacOSX
- Reprise RLM floating licenses
XCP
Debugging via XCP
- Communicates with the target CPU via XCP slave
- Supports "Software Debugging over XCP" protocol specified by ASAM e.V. as well as the ETAS-specific debugging protocol
- Almost the same debug feature as TRACE32® hardware-based debugger
- C/C++ debugging
- FLASH programming
- Access to all peripheral devices
- Multicore debugging
- Autosar-OS aware debugging
- Benchmark counters
- Cache debugging
- Debugging of all auxiliary controllers
- Multicore tracing via on-chip trace
- Support for GTM, MPC5xxx, RH850, TriCore
USB and Intel® DCI.DbC
Debugging via USB and Intel® Direct Connect Interface (Intel® DCI) DbC
- Stop-mode debugging for form factor devices
- Stop-mode debugging via USB protocol stack
- Standard JTAG is wrapped into DCI packets
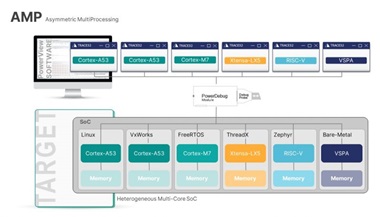
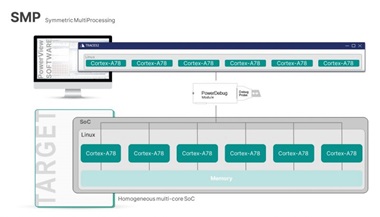
- SMP debugging (including hyperthreading)
- AMP debugging with other architectures
- BIOS/UEFI debugging with tailor-made GUI for all UEFI phases
- Linux- and Windows-aware debugging
- Support for Intel® x86/x64, ARC, M8051EW, Xtensa
USB and Tessent Embedded Analytics
Debugging via USB with Tessent Embedded Analytics
- Tessent Embedded Analytics (formerly UltraSoC)
- Full support for all IP blocks needed for debugging and tracing
- Stop-mode debugging via USB stack
- Core trace and bus monitoring via USB stack
- Support for BK5_32IMFC, E20, E21, E24, E31, E34, E76, FU540-C000, LC130, LC130S-R0, LC131-R0, N25, NX25, SCR1, SCR3
TRACE32® Simulators
TRACE32® Instruction Set Simulators
- Integral part of TRACE32®
- Configurable as system under debug (PBI=SIM)
- Allows post-mortem debugging
- Tool Qualification Support-Kit (TQSK) available for TriCore architecture
- Software compatible to all TRACE32® tools
- OS-aware debugging
- Cache simulation (architecture dependent)
- Program and data flow trace based on a bus trace protocol
- Advanced trace analysis features
- Powerful script language
- Programming interface for peripheral simulation
- Not available for processor architectures that support user-defined instructions
Universal User Interface
ASM Debugger
- Supports almost all file formats
- Assembler source-level debugging
- Advanced memory display
- Inline assembler
- Memory tests
- Customizable windows
- Peripheral windows
- Terminal window
- Semi-hosting
- Flash programming
- Full support for peripherals
High-Level-Language Debugging
.gif)
- Supports multiple languages
- Full support for C++
- Integrated into TRACE32® environment
- Supports most compilers and hosts
- Same user interface on different hosts
- High speed download
- Debugs optimized code
- Display of function nesting
- Display of linked lists
- Powerful expression evaluation
TRACE32® Instruction Set Simulators
- Integral part of TRACE32®
- Configurable as system under debug (PBI=SIM)
- Allows post-mortem debugging
- Software compatible to all TRACE32® tools
- OS-aware debugging
- Cache simulation (architecture dependent)
- Program and data flow trace based on a bus trace protocol
- Advanced trace analysis features
- Powerful script language
- Programming interface for peripheral simulation
- Not available for processor architectures that support user-defined instructions
.gif)
TRACE32® Front-End
.gif)
- Front-end to third-party virtual targets
- Front-end to third-party core simulators
- Front-end to third-party target servers
- Front-end to TRACE32® Back-End
- Same GUI as TRACE32® hardware debuggers
- Debug features as provided by third-party software/TRACE32® Back-End
- Trace features as provided by third-party software/TRACE32® Back-End
- Windows, Linux and MacOSX
- Reprise RLM floating licenses
ROM Monitor
- Compatible with Emulator
- Support for C,C++ and ASM
- Communication via Eprom Simulator
- Communication via RS232 or customized .DLL link
- Windows9x, WindowsNT and Unix
- Monitor Code with Source
- Monitor Code Royalty Free
Logical Display of Peripherals
.gif)
- Display of onchip peripherals
- User definable windows
- Interactive window definition with softkey support
- Pulldown menues for selection of choices
- Additional description for each field
Script Language PRACTICE
- Structured Language
- Menu Support
- Command Logs
- Custom Menues
- Custom Toolbars and Buttons
- Custom Dialog Windows
- 64-Bit Arithmetic
- Numeric, Logical and String Operators
- Direct Access to System States
Trace-based Debugging (CTS)
.jpg)
- Allows re-debuggging of a traced program section
- Provides forward and backward debugging capabilities
- High-level language trace display including all local variables
- Timing and function nesting display
- Has the ability to fill most trace gaps caused by the limited bandwidth of trace port
Logger
- Software trace of any size stored in an array structure on the target
- General trace format provided by TRACE32®-PowerView
- Configuration and display commands provided by TRACE32®-PowerView
- Works as trace with address and data information
- Works as a program flow trace (SH4, PowerPC)
- Time stamp possible
- Predefined algorithms to fill the trace provided by Lauterbach
- User defined algorithms to fill the trace also possible
Snooper
- Samples memory while application is running
- Support for special debug communication channels
- All trace display and analysis functions can be used
- Trigger on specific values
- Dynamic performance analysis
Trace-based Profiling
- Detailed analysis of function run-times
- Detailed analysis of task run-times and state
- Graphical analysis of variable values over the time
- Analysis of the time interval of a single event (e.g. Interrupt)
- Analysis of the time interval between 2 defined events
.gif)
Sample-based Profiling
.gif)
- Long-time performance analysis for functions
- Long-time performance analysis for tasks
- Long-time analysis of the contents of a variable or memory location and more
Trace-based Code Coverage
- Real-time code coverage without instrumentation
- Suitable for long-term testing
- Support for all common code coverage metrics
- Automated report generation
- Full support of multicore chips
.gif)
Memory Analysis
- Display of allocated memory blocks
- Memory allocation Statistics
- Check for out-of-bounds writes
- Trace of allocation calls
- Graphical displays of memory usage
FLASH Programming (Memory-Mapped)
- Optimum flash programming performance
- Support for all file formats
- Ready-to-run flash scripts
- Ready-to-use flash programming algorithms
- Dialog- or command-based programming as well as full scripting
- Full awareness of sensitive data
- Flash declaration via CFI
- Easy handling of different flash types on a target
- Software breakpoints in flash
- Simple code patching in flash
- Flash programming via boundary scan
.gif)
FLASH Programming (Protocol-Based)
.gif)
- Optimum flash programming performance
- Support for elf, Intel hex and S-record format
- Ready-to-use flash programming scripts
- Ready-to-use flash programming algorithms
- Memory dump for displaying the flash content
- Flash content can be easily copied and modified
- Flash programming via boundary scan (SPI, eMMC, I2C)
- Full programming access to spare area (NAND)
- Bad block treatment (NAND)
- ECC generation: Hamming, BCH, Reed-Solomon (NAND)
Multicore Debugging
- Debugger for all cores of a multicore chip
- Debugging of application cores, DSPs, accelerator cores and special-purpose cores
- Debugging of more than 80 core architectures
- Support for every multicore topology
- Support for all multicore operation modes
- Support for AMP and SMP systems
- Single debug hardware can be licensed for all cores of a multicore chip
TPU Debugger (68332, MPC55x/56x)
- Full support of TPU1, TPU2 and TPU3
- Step and Go commands
- Supports all TPU Breakpoints
- Disassembler for Microinstructions
- Monitor all TPU Registers during stepping
- Modify TPU internal Registers
- Display of Entry Points
- Peripheral View of TPU Registers
OS-aware Debugging
- Real-time, non-intrusive display of RTOS system resources
- Task stack coverage
- Task related breakpoints
- Task context display
- SMP support
- Task related performance measurement
- Statistic evaluation and graphic display of task run times
- Task related evaluation of function run times
- PRACTICE functions for OS data
- Easy access via RTOS specific pull-down menus
- Support for all major RTOSes
.gif)
3rd Party Tool Integration
- Editor Integration
- CASE Tool Integration
- Kernel Integration
Remote Control
TRACE32® Remote API
The TRACE32® Remote API enables Lauterbach customers to control TRACE32® and access the device under test from another program. Typical use cases are:
- Integration of TRACE32® into an automated production environment
- Using TRACE32® as an interface to the device under test for test and measurement systems
- Using TRACE32® as an interface to the device under test for third party tools
The TRACE32® Remote API can be used to control several TRACE32® PowerView instances simultaneously. This is possible by establishing one socket stream per PowerView instance. It does not matter whether the device under test is a physical or virtual target or an instruction set simulator.